Finding small areas in large tissues
In SEM blockface imaging, it is quick and simple to produce overviews of large tissue sections (see below). Then, a much smaller, specific area can be localized and imaged at higher magnification to study morphology and/or to quantify features using a stereology approach.
Hannah Somerfield/Dr Adrian Butcher, Professor Giovanna Mallucci’s Group, UK Dementia Research Institute, University of Cambridge – Quantification of synapses in a mouse model of neurodegeneration

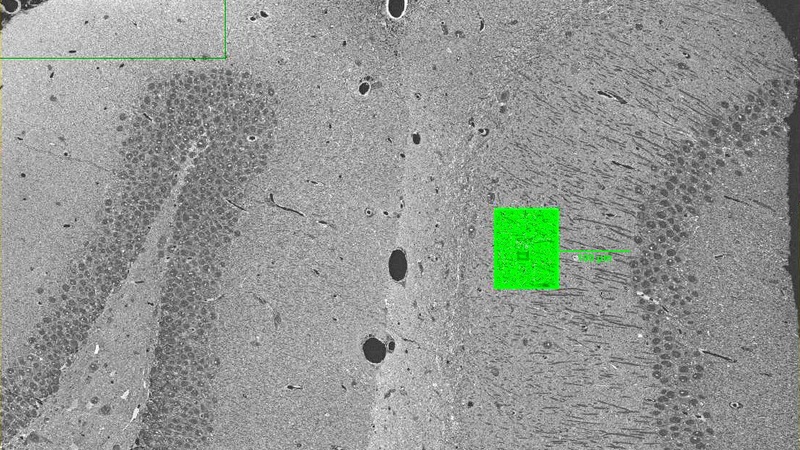
Partial overview map of a mouse brain vibratome slice. The column of nuclei on the right denotes the area of the hippocampus. At a distance of 100 um from the hippocampal nuclei a mapping area was defined (green square) and imaged at higher resolution.
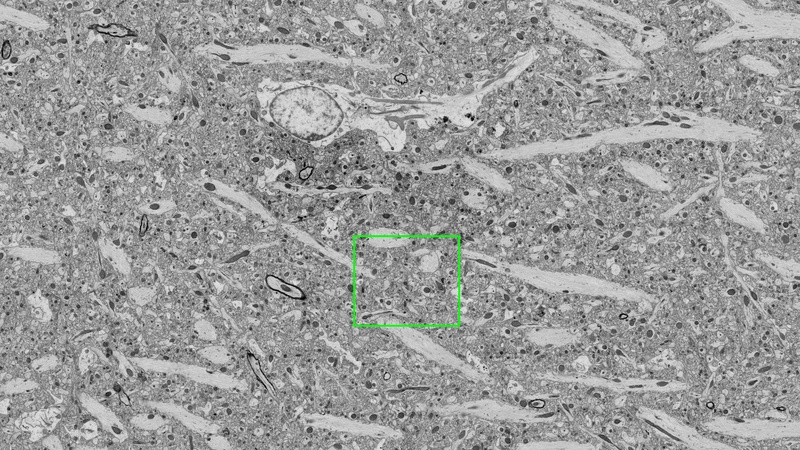
High resolution map of the synaptic region of the hippocampus. The area in the green square is shown below in more detail.

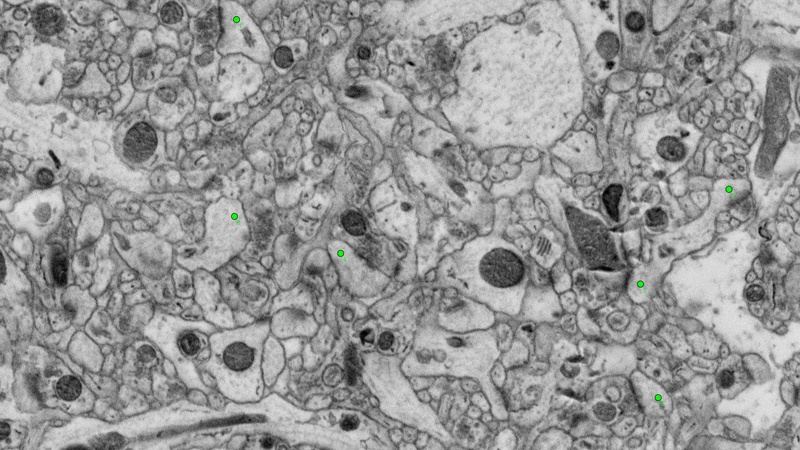
On zooming in on the high-resolution map (green inset), synapses characterized by docked pre-synaptic vesicles and post-synaptic density can be identified; six synapses are highlighted by the green dots.

