
SE/SEM-CLEM
In SE/SEM-CLEM (correlative light-electron microscopy), cells imaged first by light or fluorescence microscopy are subsequently processed for SE-imaging in the SEM to reveal aspects on the surface of the same cells. Light/fluorescent images can then be overlaid with the corresponding SEM images.
Studying the morphology of the cortical cytoskeleton in relation to cell cycle phase (Ruby Peters, Ewa Paluch Group, Department of PDN, Cambridge).
In animal cells, cell shape changes are largely driven by the actomyosin cortex, a thin cytoskeletal network (~ 150 nm thick) that lies directly beneath the plasma membrane. The nanoscale architecture of the cortex and its role in driving cell shape changes remains poorly understood. This project investigated how changes in cortex architecture correlate with changes in cortical tension upon cell cycle progression. In HeLa cells, cortical tension increases over threefold between mitotic cells and rounded interphase cells. In both phases, the cells adopt a rounded morphology and SEM imaging alone cannot distinguish between them. In a CLEM approach, cellular DNA was imaged by fluorescence microscopy to establish cell cycle phase prior to imaging the actomyosin cortex of the same cells by SEM.
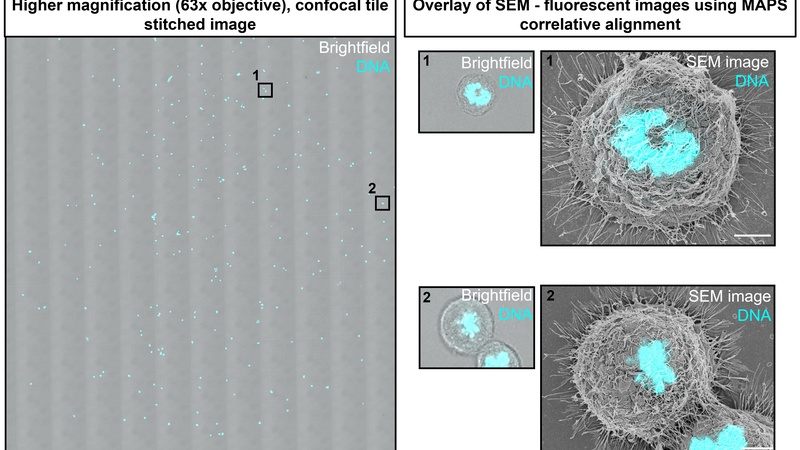
Left: HeLa cells stained with DAPI - tiled overview image with marker positions taken in a Leica SP8 confocal microscope, CAIC. Right: DAPI-SE/SEM overlays of M-phase cells at defined marker positions, scale bar is 10 um.
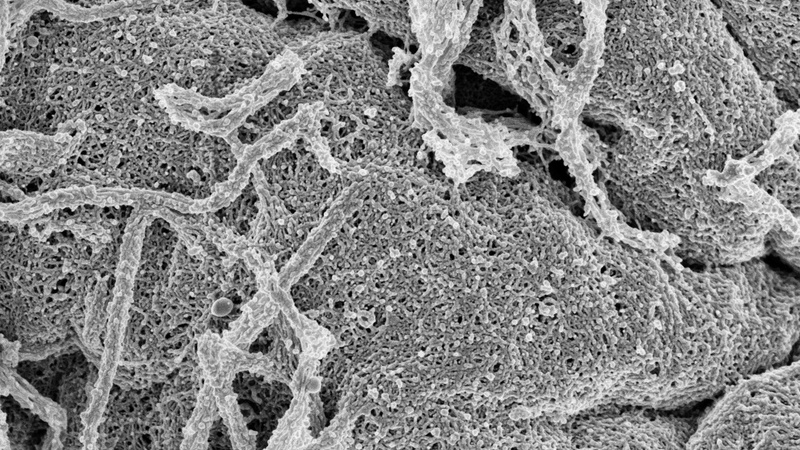
After establishing the cell cycle phase using the DAPI staining and a treatment to expose the cortical cytoskeleton, the architecture of the actomyosin cortex of the same cell was analysed in more detail in SEM images at higher magnification.
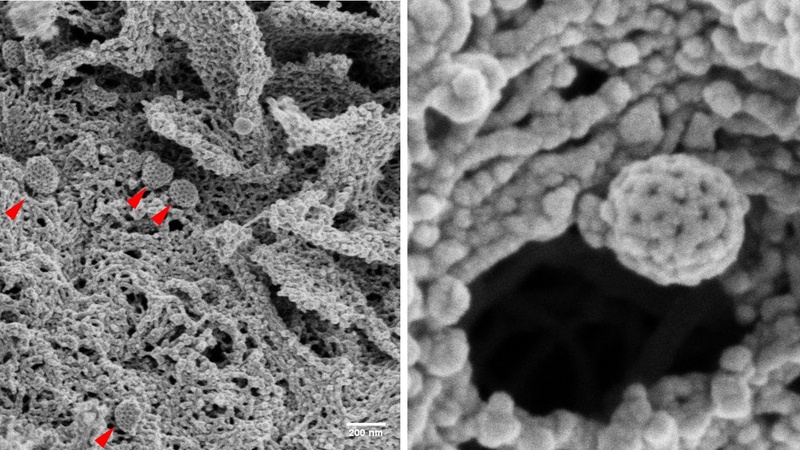
Frequently, coated pits (red arrows) were seen on the cell surface, easily recognizable by their regular clathrin network.
The technique: SE/SEM-CLEM with MAPS™ correlative workflow
For SE/SEM-CLEM, cells are grown on a gridded support and are stained for fluorescence microscopy. A tiled overview image with visible position markers is taken in the light or confocal microscope as well as higher magnification images of particular cells of interest in transmitted (position markers) and fluorescent modes. Subsequently, the cells are processed for SE/SEM imaging (by plunge-freezing/freeze-drying, critical point drying or HMDS drying) and mounted for SEM.
The tiled overview image from the light/confocal microscope is imported into the Verios MAPS software (FEI/ThermoFisher Scientific) and SEM preview images are taken of at least two marker positions of the SEM sample.
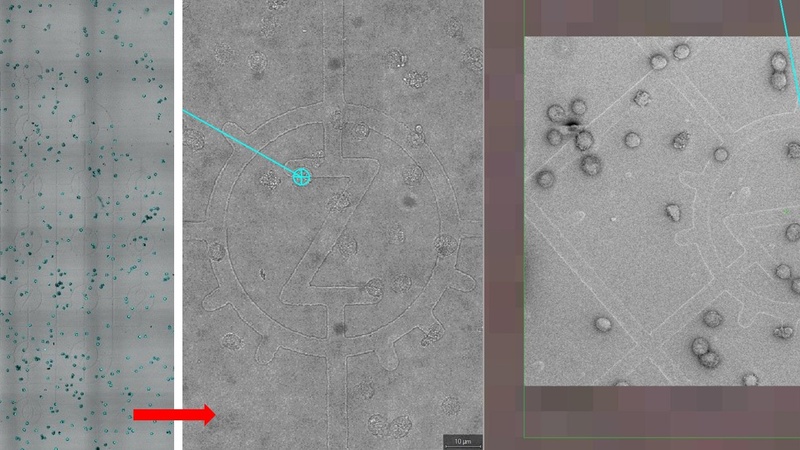
Tiled overview image of grid support (left) showing marker positions (transmitted image) and cells (blue). Imported into the MAPS software, both the tiled image (middle) and acquired SEM preview images (right) can be zoomed for finding specific marker positions.
After linking two corresponding marker positions, the MAPS software aligns the imported tiled image with the SEM microscope stage. Clicking on any cell/marker in the tiled image will now drive the SEM stage to that location.
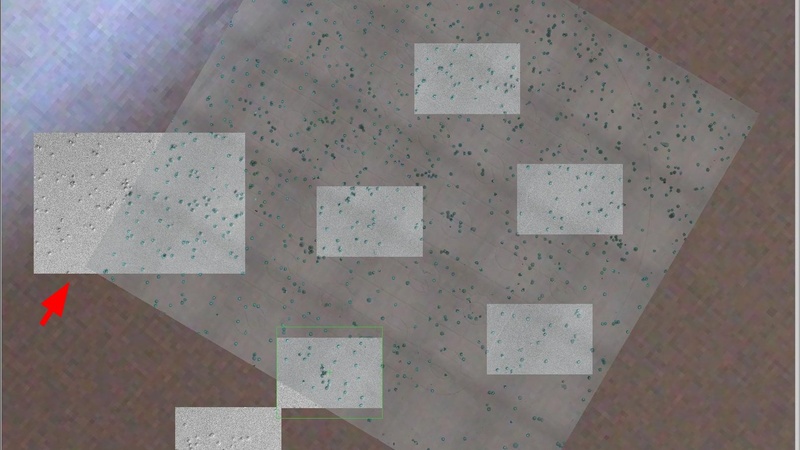
MAPS software after alignment: the imported tiled image (large grey square) is now rotated to align with the SEM sample on the microscope stage. The larger SEM preview image on the left (red arrow) overlaid over the imported tile image shows the correct alignment.